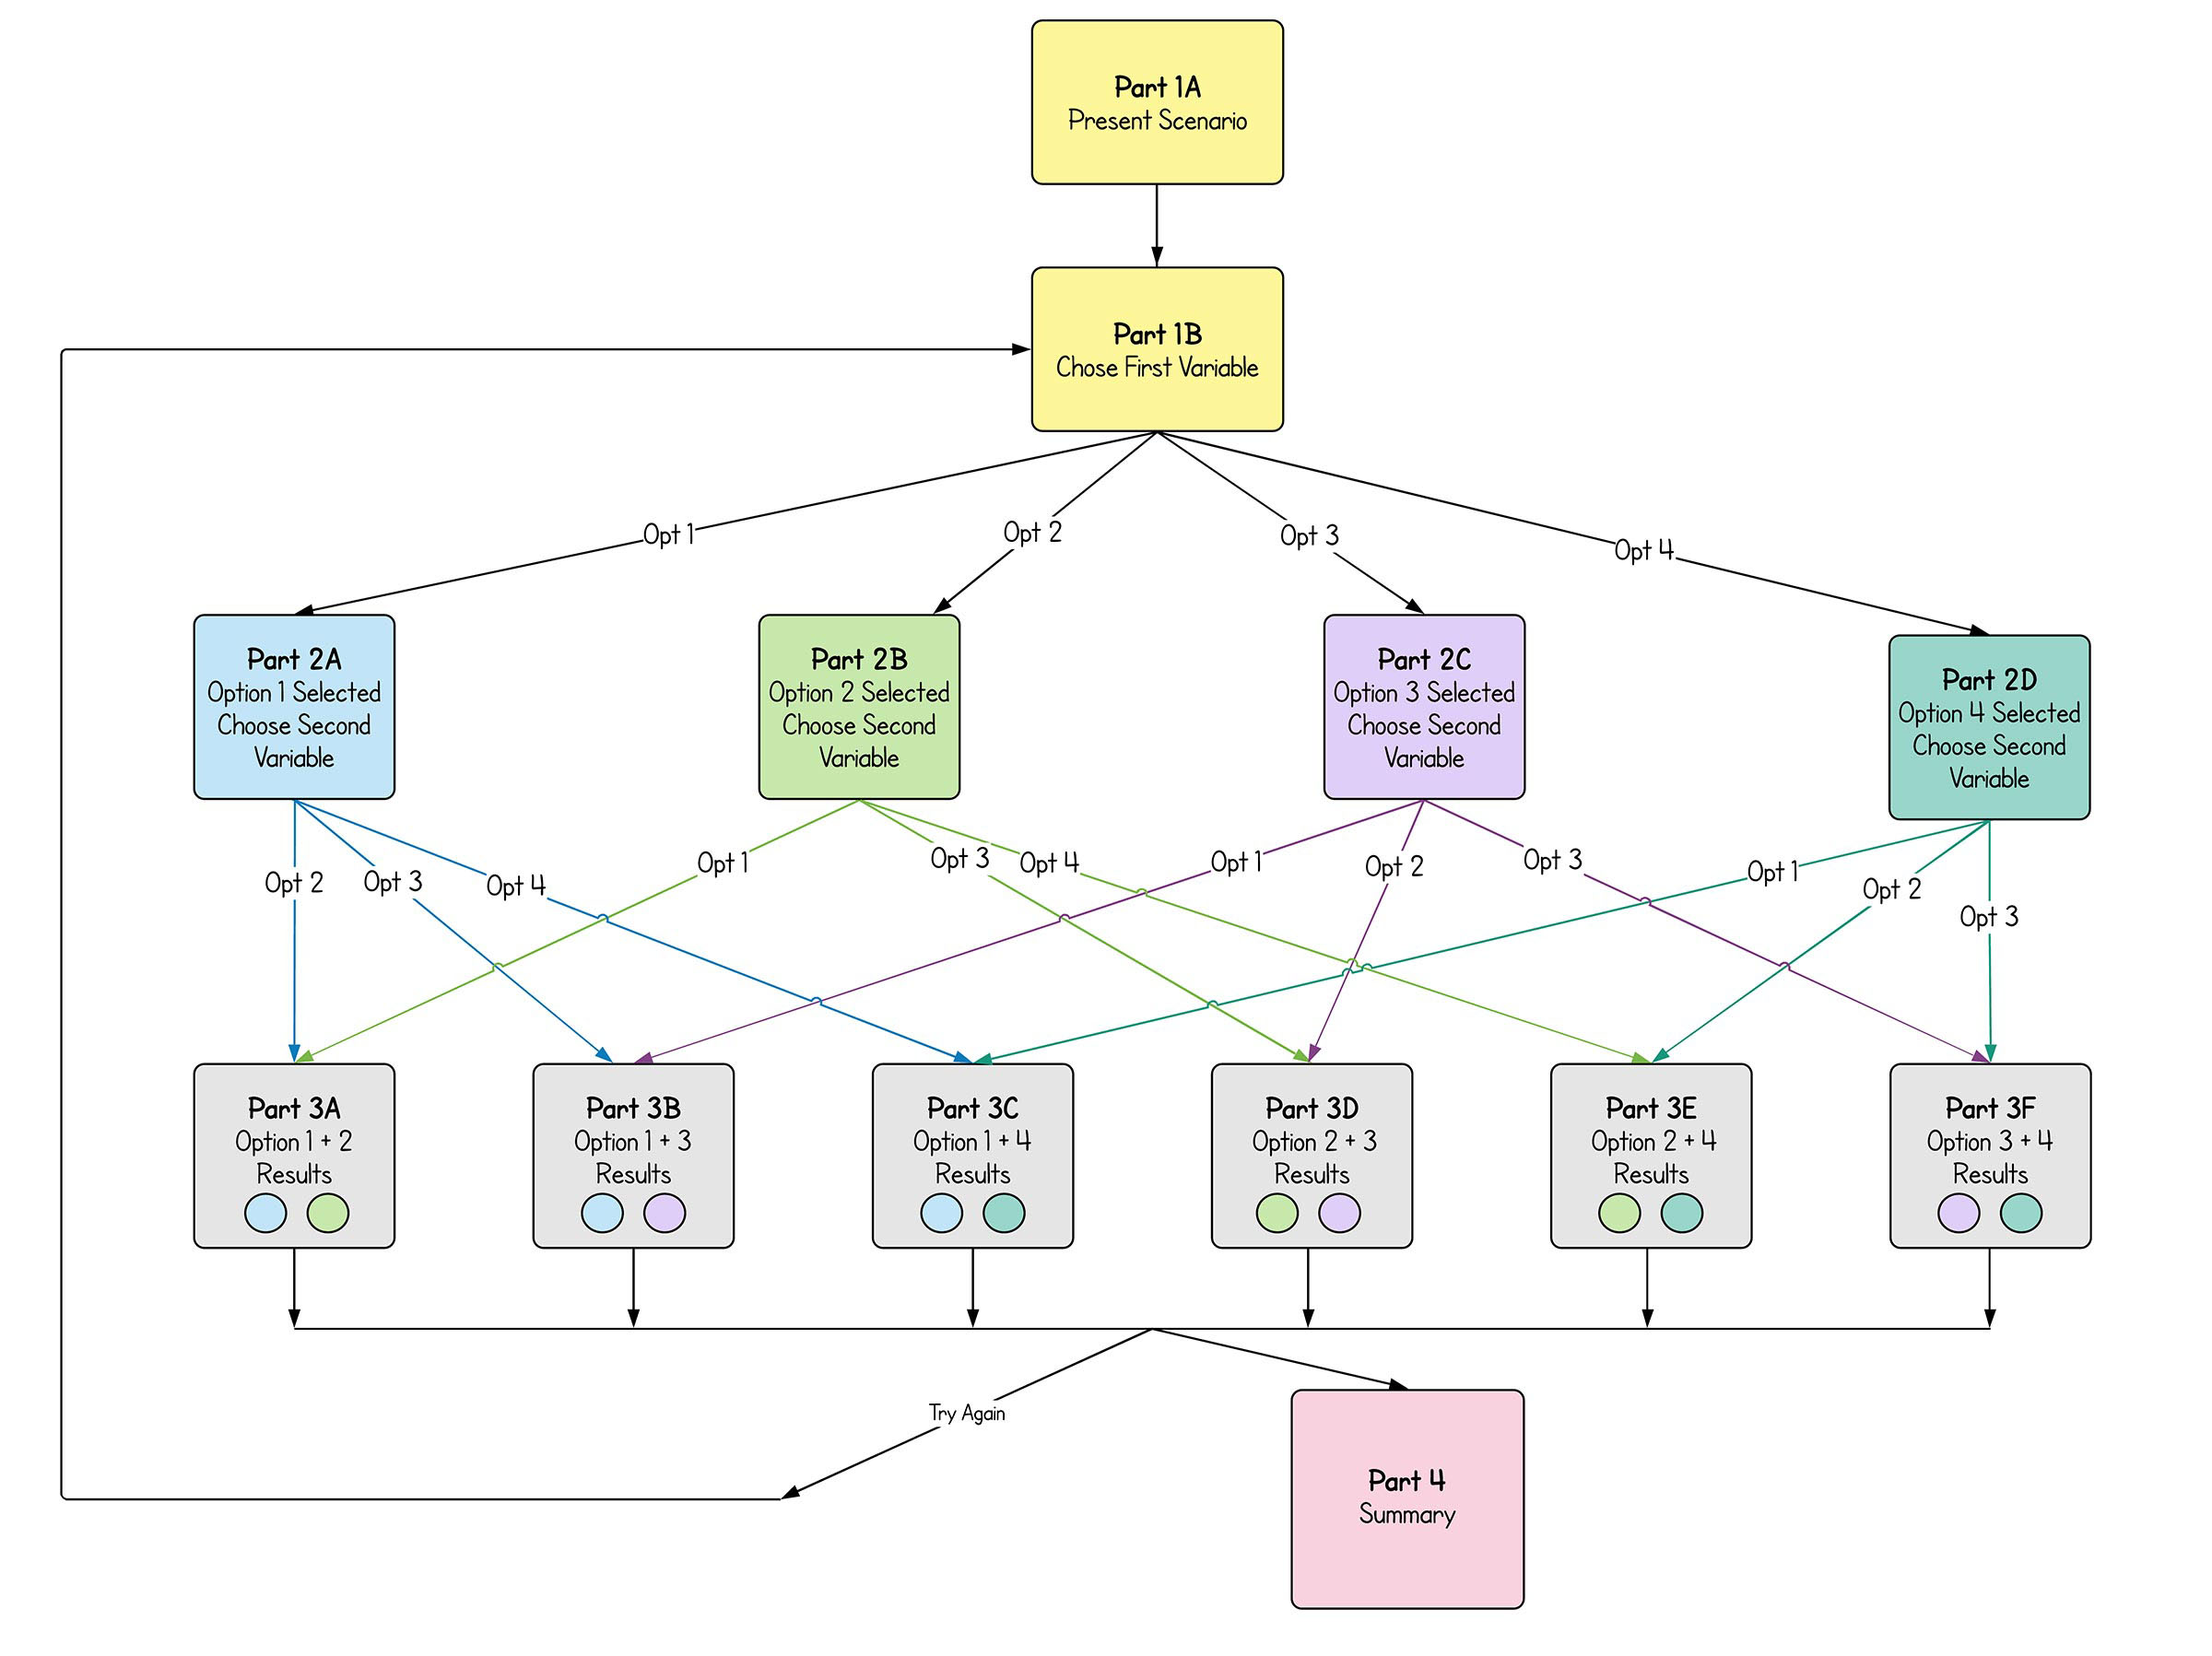
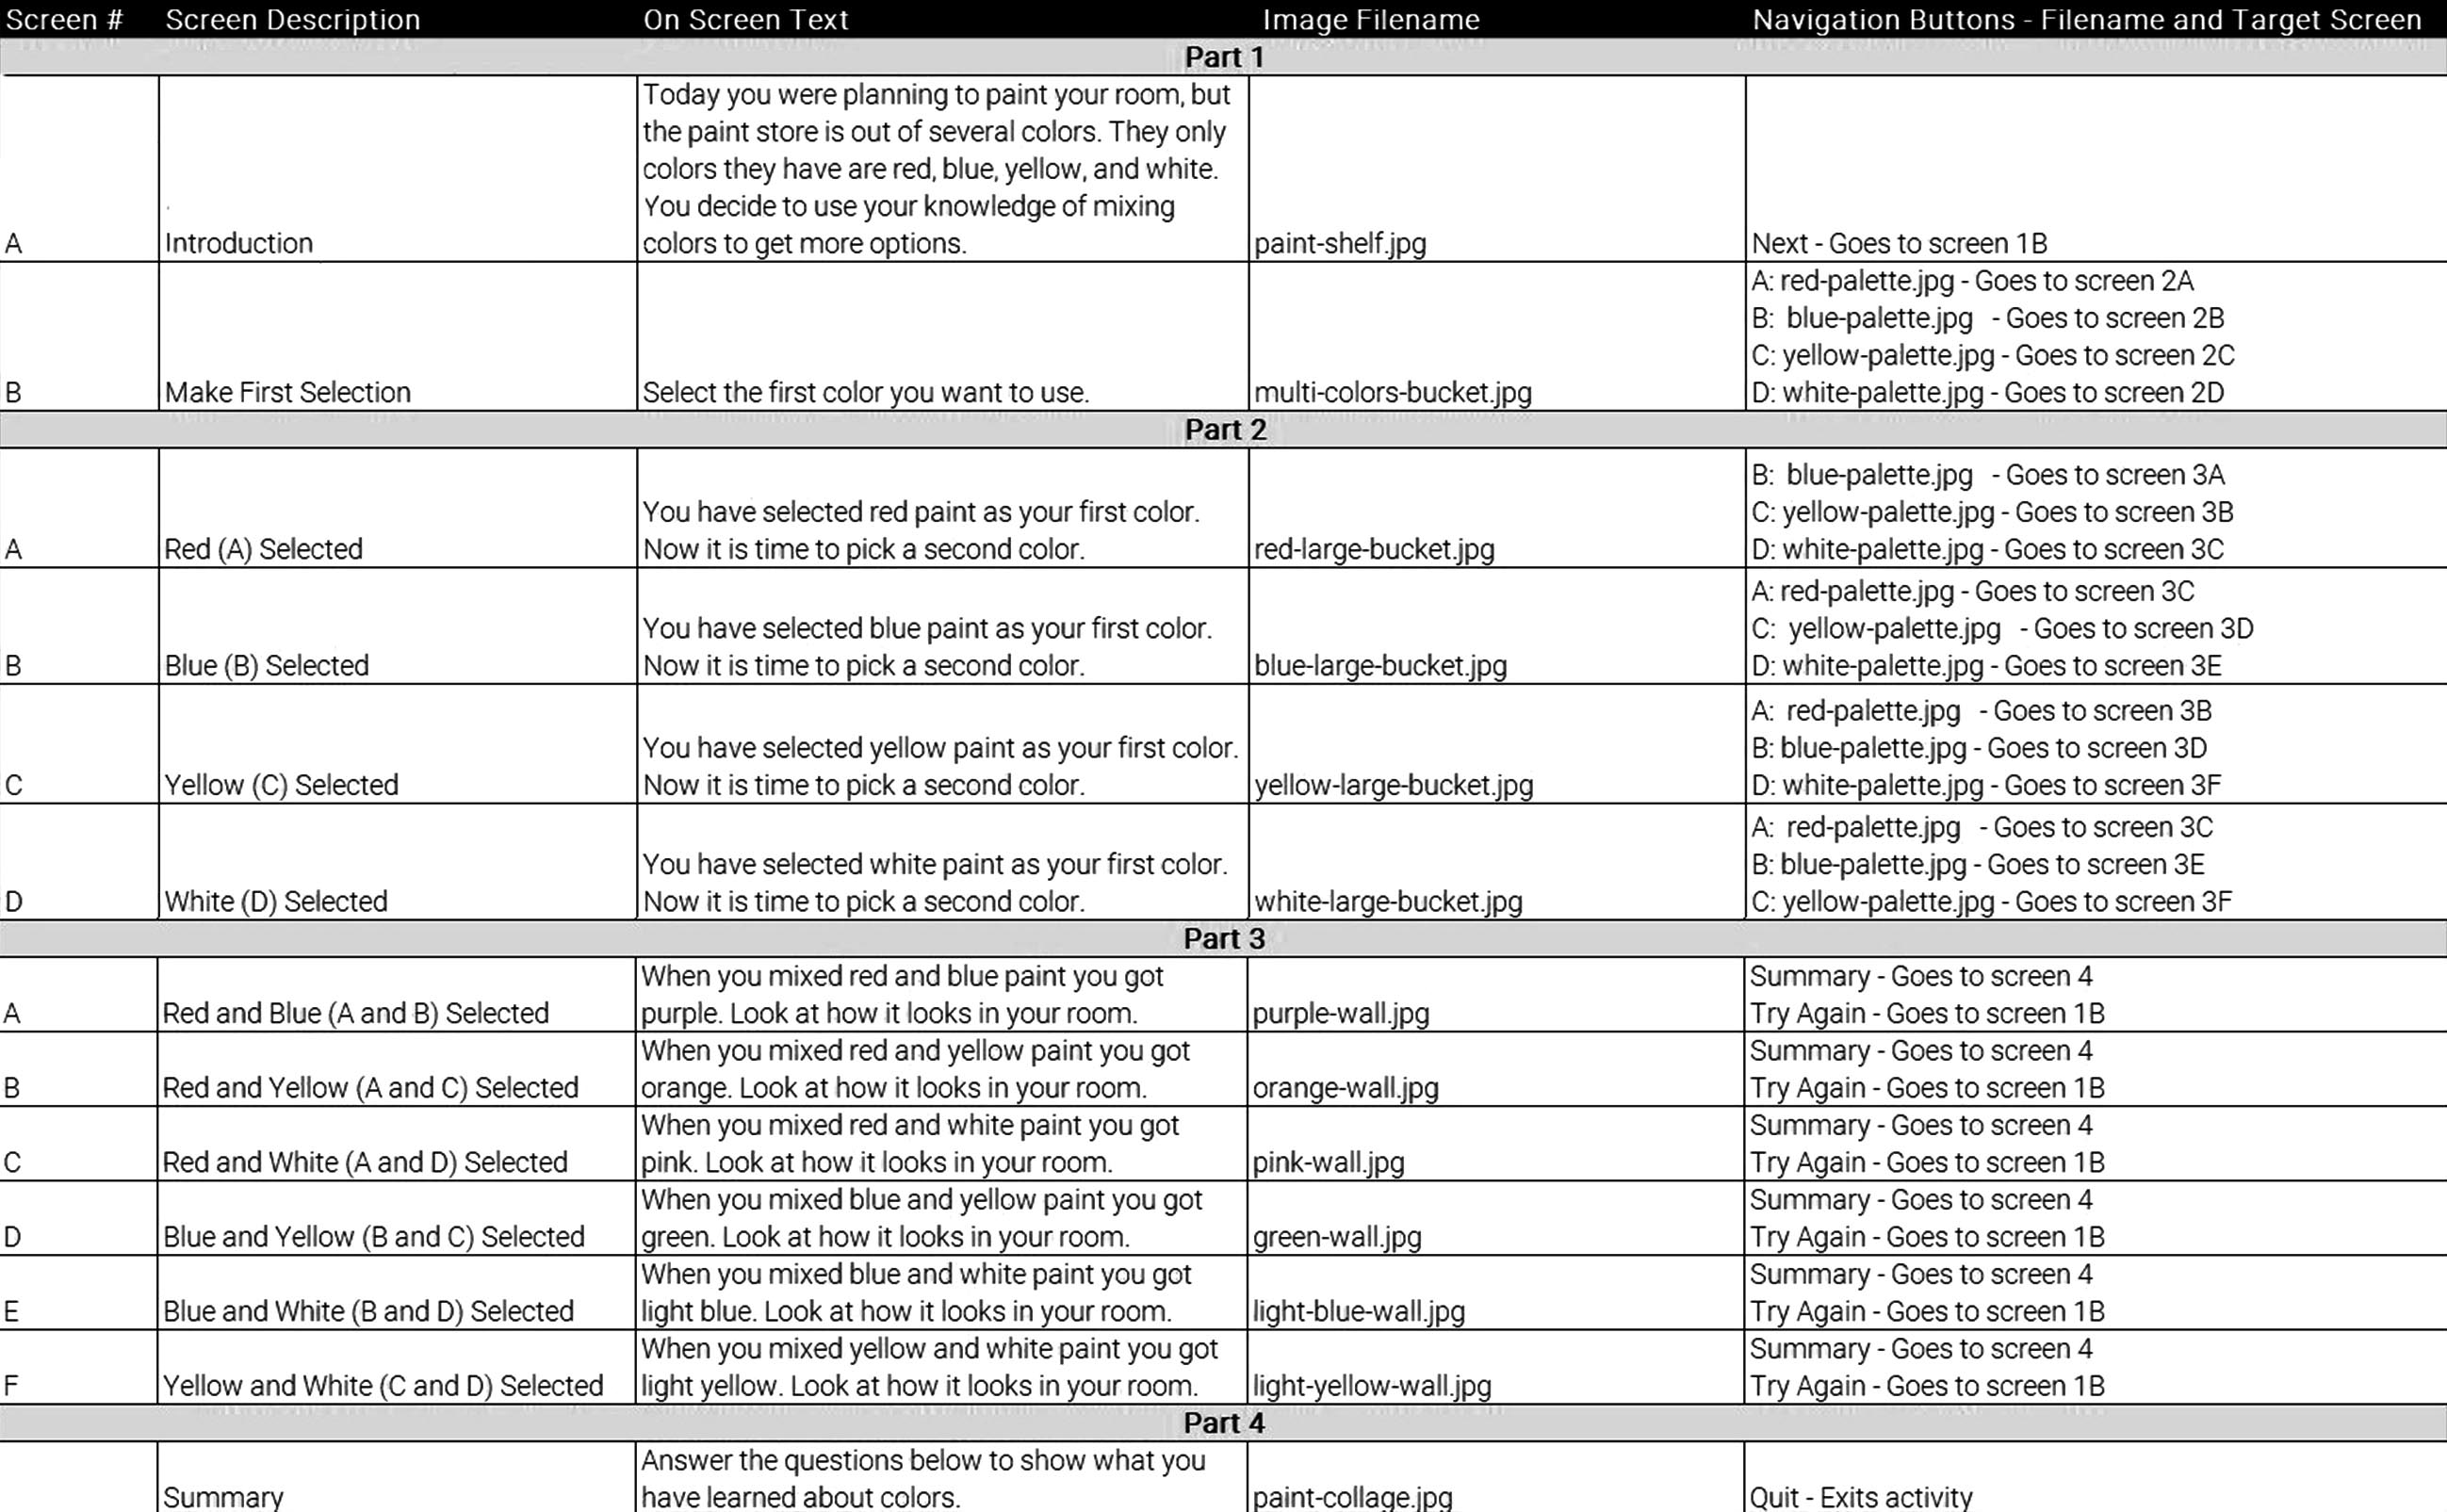
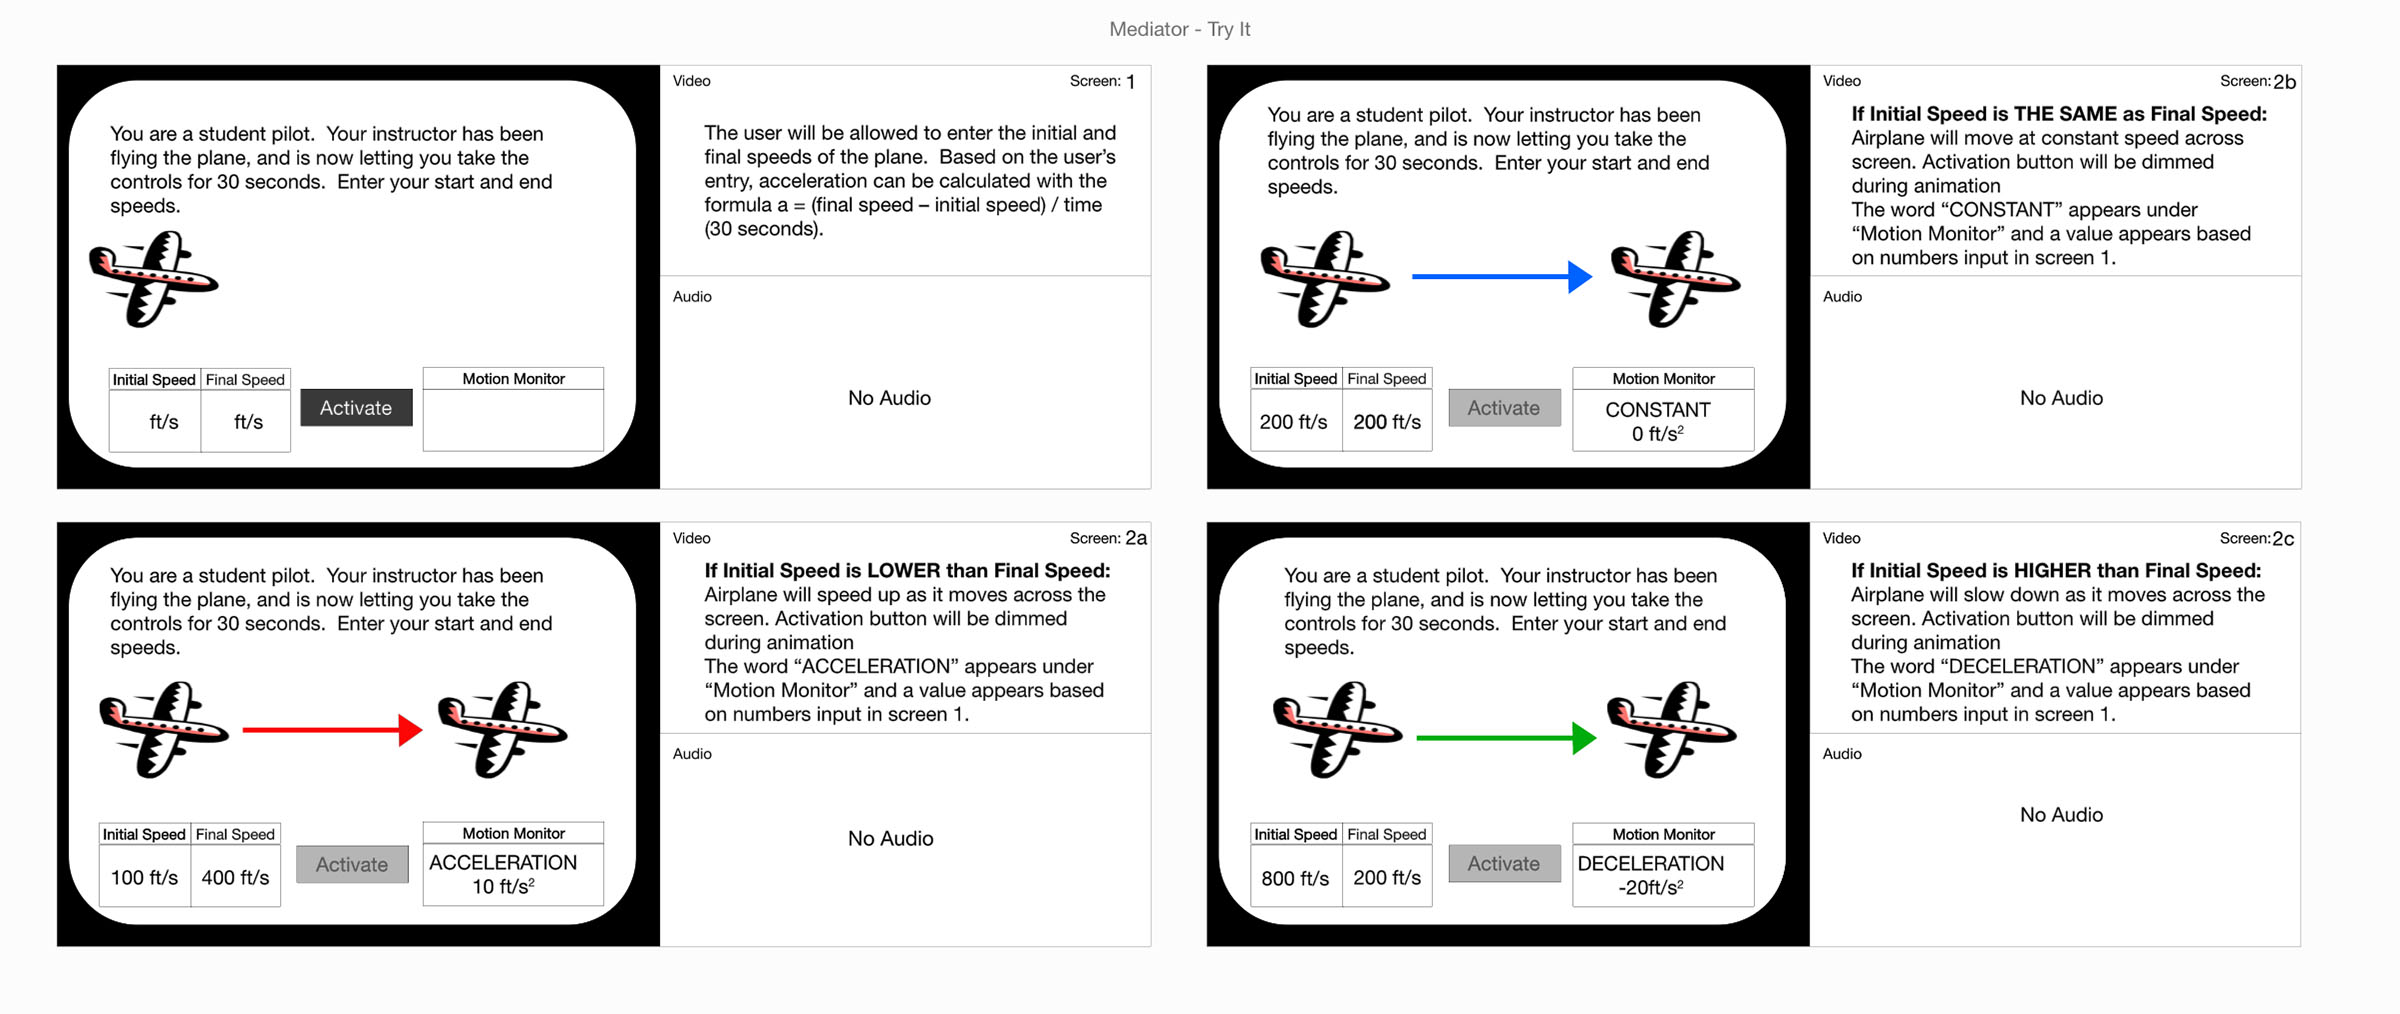
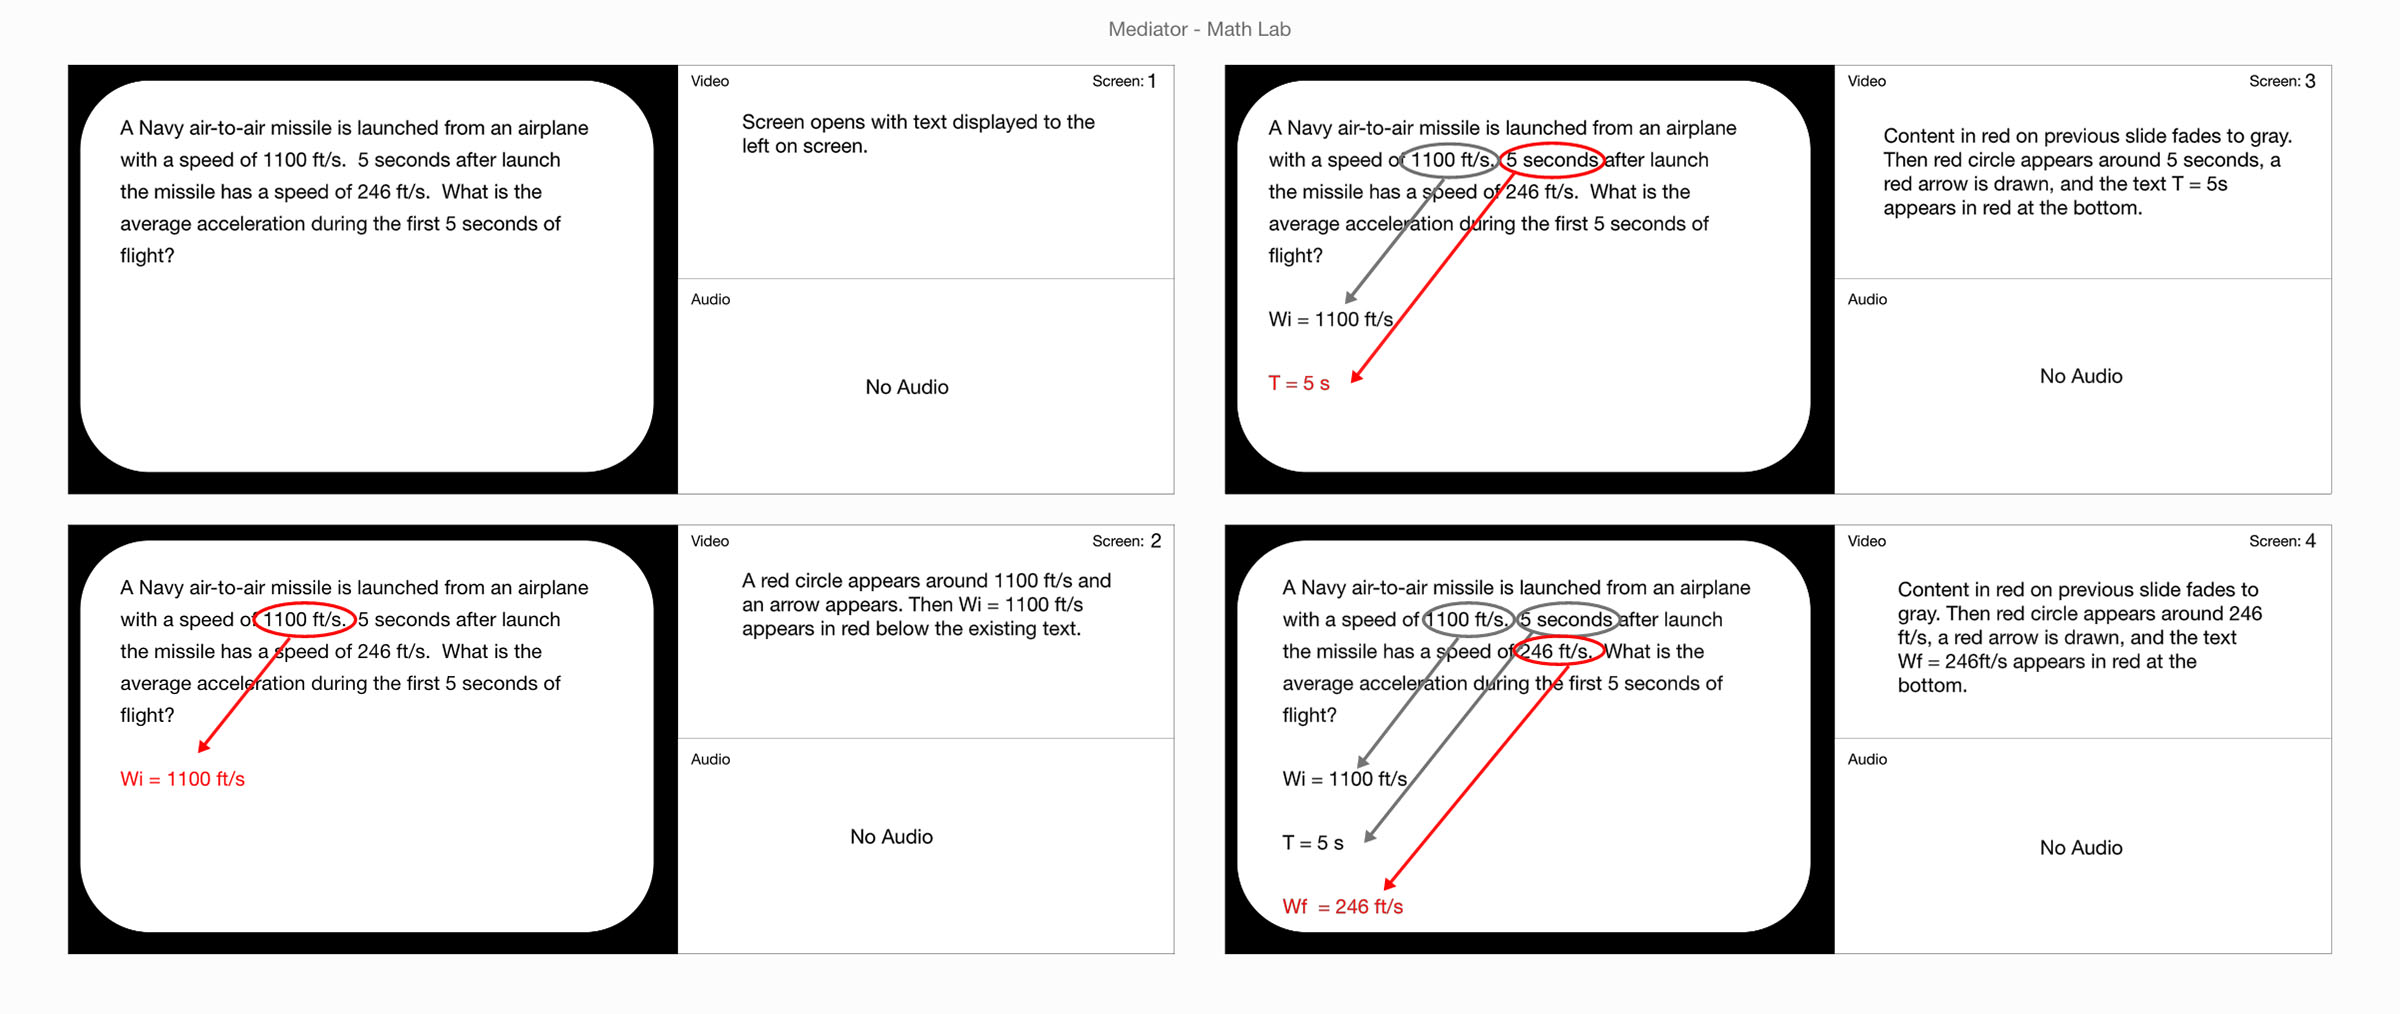
Process Documentation

I’ve found that when working with interactive functionality it’s important to document the plans. This helps communicate with non-technical team members as well as developers, and helps the production process go smoothly. Below are some examples of the kinds of documentation I’ve created.


Flowcharts

When developing a series of simulations, I created several pieces of documentation to map out how the interactions would work. The flowchart below is part of a series of flowcharts I created using LucidChart. The purpose of this was to demonstrate all possible paths through one of the digital simulations. It illustrated what end-users would see as they navigated through the activity, and served as a reference for the rest of the development team.

Flowchart of a plant simulation.

Authoring Spreadsheets

Flowcharts are great at showing a high-level overview of how digital content will appear, but I’ve needed to track additional details to fully author the content. As part of the same series of digital simulations described above, I created and populated spreadsheets capturing details about what needed to appear on each screen of the activities. One example of these is shown below.

Spreadsheet containing authoring data.

Storyboads

While doing freelance work, I worked on a product called The Mediator. This was an instructional design tool that used multimedia, animations, and interactivitiy to introduce, review, and reinforce science topics to high school students. I created storyboards that documented both animations and interactive components of the product. These storyboards were given to the teams creating final art and animations to use as a starting point for their work. Below are two of the five sets of storyboards I developed for this project. One shows how the screen changes based on different user inputs and the other documents each step of an animation walking through the solving of a math problem.

Storyboard showing animation of a plane accelerating and decelerating. Storyboard showing animation of math calculations.

Style Guide

As part of a user experience design class, I designed content for an online site and app. This involved selecting colors, fonts, and UI elements, like buttons and icons. In order to ensure a consistent style was used across all elements, I created the style guide below that captured all design decisions and documented them in an easy to read way. This project was done for a fictional business, but if this were for a real business the style guide would be distributed to others working on the product to make sure everyone followed the same design specs.

Styleguide with font styles, color palette, logos, icons and UI elements, and button states.

See additional samples: